Power Monitoring
Optimize power consumption
Effortless powering monitoring at your fingertips. Find stranded capacity. Visualize dependencies. Improve uptime.

View power connectivity and dependencies
Interactive power paths are just a click away. Map devices to power sources for enhanced control.
Track PUE, total output power and total energy
See real-time updates and track changes. Set sensor thresholds for email alerts.
See power usage at a rack and circuit level
Visualize, assess and make well-informed business decisions to reduce energy consumption.
Unlock stranded capacity and reduce wastage
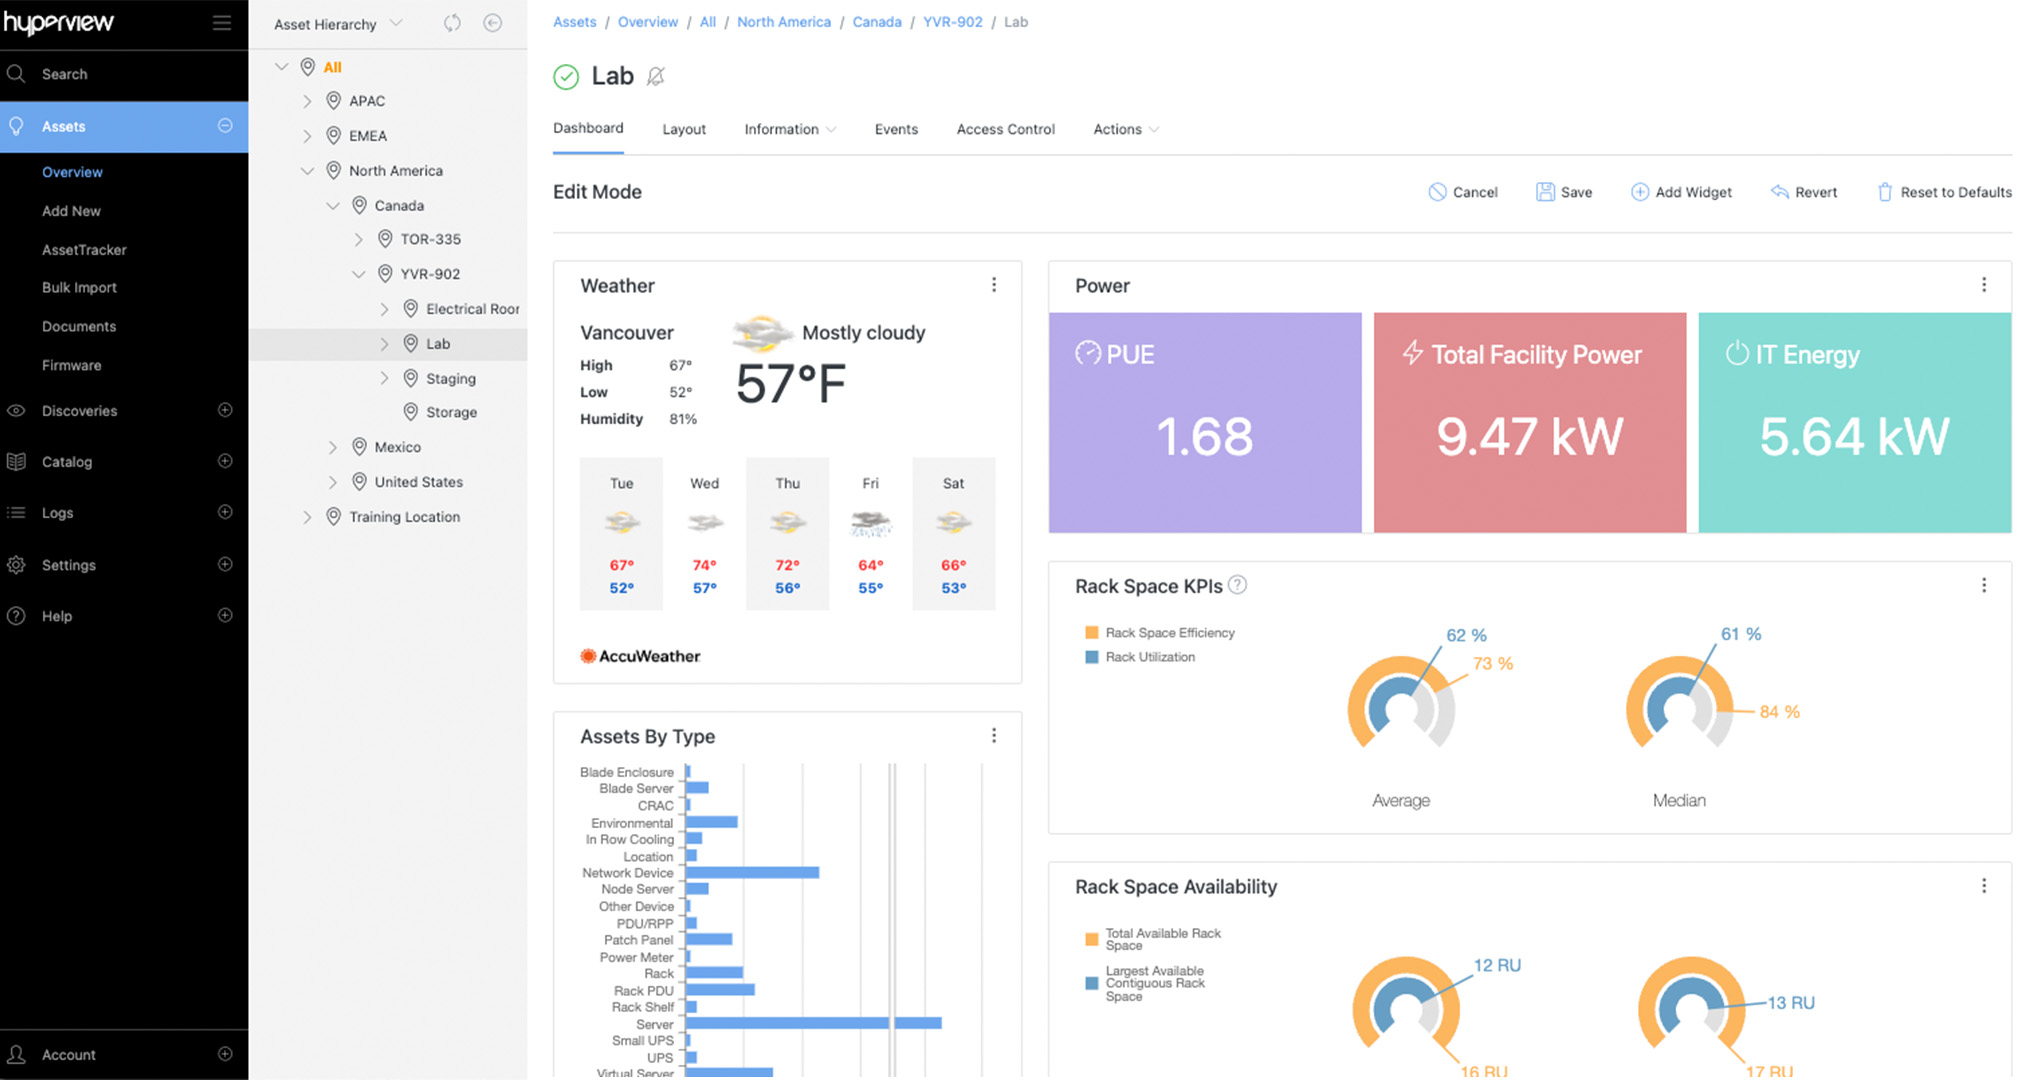
Stay on top of your key power metrics with ease. The Power widget tracks your PUE, Total Facility Power, and IT Energy consumption.
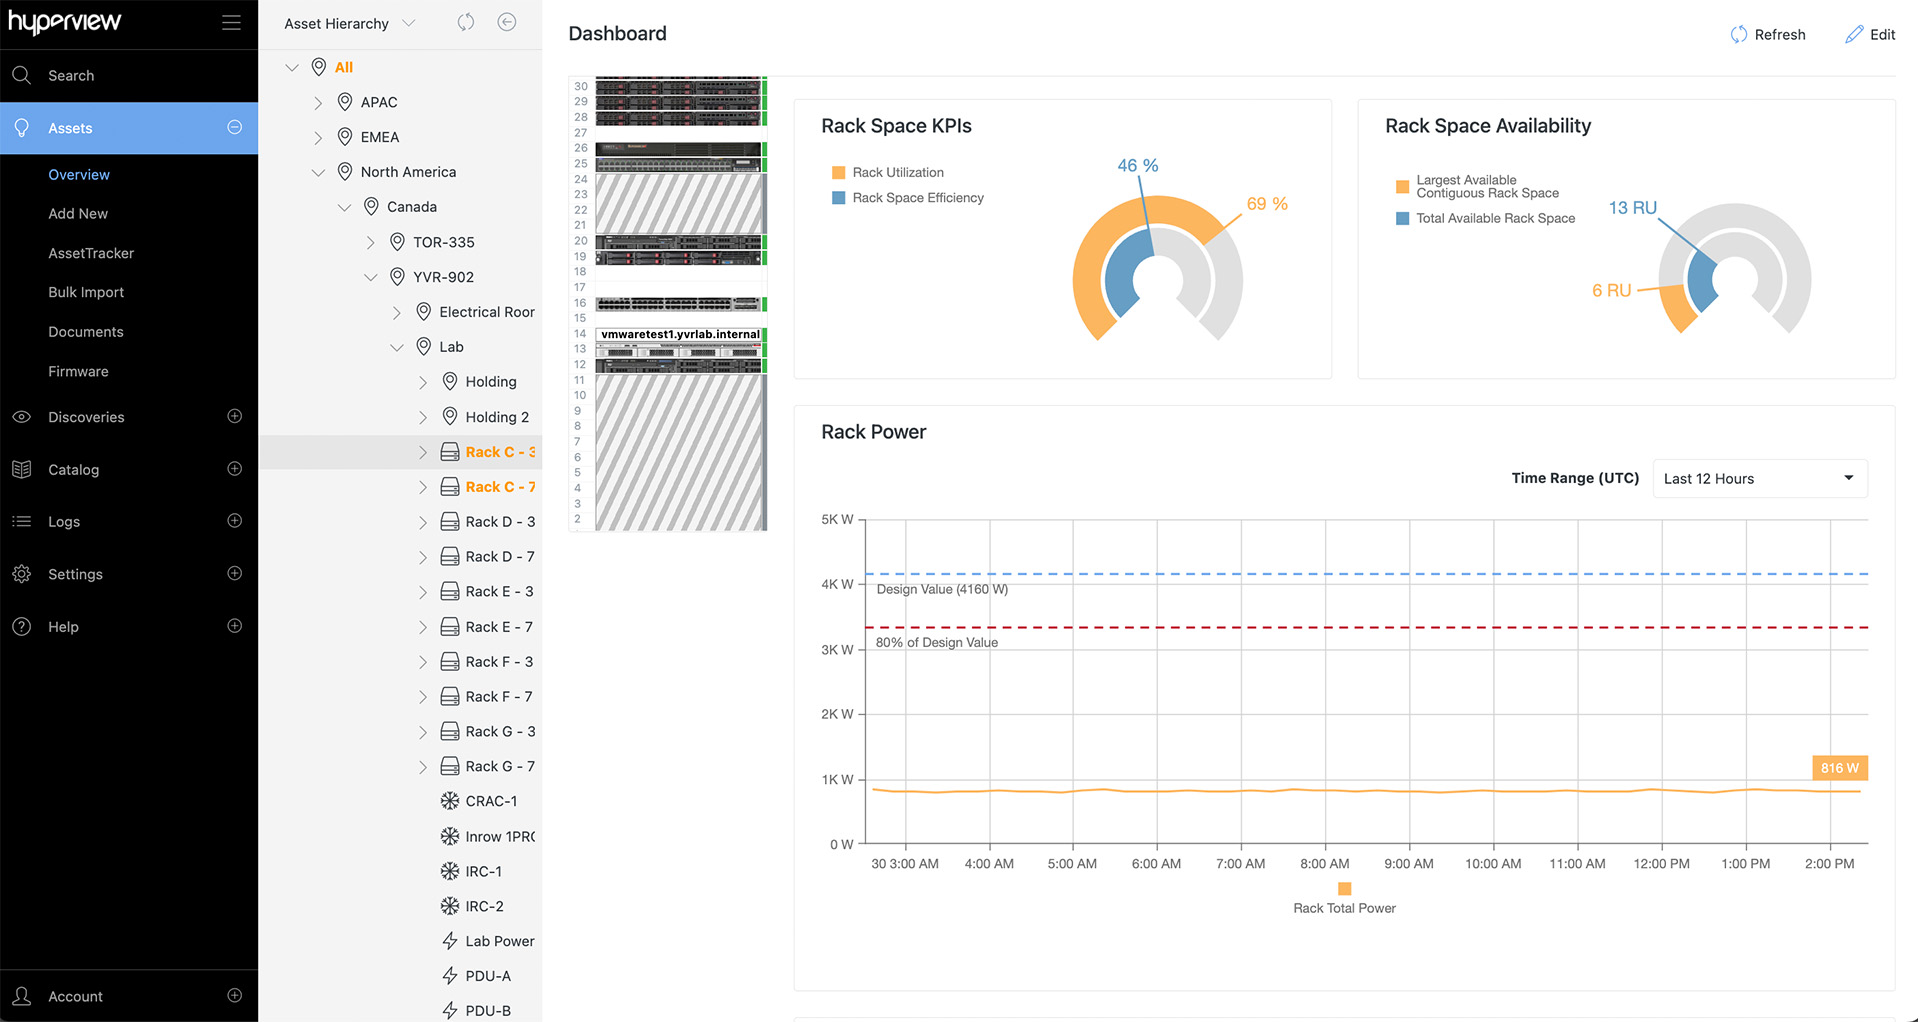
Track total output power over time from your dashboard. For busways, generators, PDU/RPP, UPS, power meters, transfer switches, and utility breakers.

Measure total power usage vs. budgeted capacity at the rack-level. Get alerts if a threshold is reached.
Unlock stranded capacity and reduce wastage

Key Power Metrics
Stay on top of your key power metrics with ease. The Power widget tracks your PUE, Total Facility Power, and IT Energy consumption.

Total Output Power Graphs
Track total output power over time from your dashboard. For busways, generators, PDU/RPP, UPS, power meters, transfer switches, and utility breakers.

Rack-level Power Usage
Measure total power usage vs. budgeted capacity at the rack-level. Get alerts if a threshold is reached.

Click to enlarge
Wait, there’s more…
Hyperview is an all-inclusive DCIM platform with awesome features to help you cut costs and manage risks like a pro. Explore the powerful tools included to level up your experience.
Get started!
No credit card needed. Access all the features.